Natural gas is a non-renewable, odorless, colorless hydrocarbon. It is measured in million British thermal units (mmBTUs), or in some countries in Gigajoule. But in natural gas reports, you will find Bcf, which is the abbreviation for billion cubic feet of gas.
We use it to heat, to generate electricity and as the fuel for our vehicles.
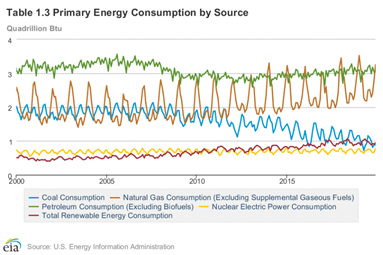
It is no exaggeration to say that natural gas is one of the most important sources of energy in the world. It accounts for more than 25% of U.S. energy consumption.

Therefore, its price influences almost every household – directly or indirectly.
If you want to know more about natural gas prices, you have to start with gas storage reports. But where to find the latest daily or weekly natural gas report – and how to analyze it?
Natural gas report
The #1 country by natural gas consumption is the U.S.
Therefore, the best place to check the natural gas storage is the reports of the U.S. Energy Information Administration, or EIA.
The Department of Energy releases the natural gas storage estimates every Thursday.
There are 3 credible sources of information (reports) about natural gas. The first is the weekly natural gas storage report.
1. Weekly Natural Gas Storage Report
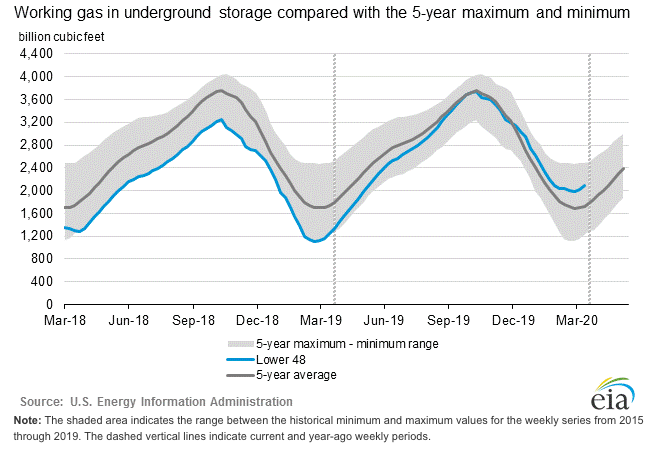
There are lots of interesting data in this report, for example:
-
underground working natural gas inventories level
-
weekly net change
-
comparisons to historical levels
-
statistical measures for each of the five U.S. regions
The information is presented on graphs.

But you can find text summaries, too — for example:
“Working gas in storage was 2,097 Bcf as of Friday, April 10, 2020, according to EIA estimates. This represents a net increase of 73 Bcf from the previous week. Stocks were 876 Bcf higher than last year at this time and 370 Bcf above the five-year average of 1,727 Bcf. At 2,097 Bcf, total working gas is within the five-year historical range.”
The number is always released at 10:30 a.m. ET on Thursday. The natural gas prices relative to the actual storage will give you a really good hint of the pricing of natural gas around specific storage levels.
The weekly natural gas inventory report can be found here.
Now, let’s move on to the next report.
2. Natural Gas Storage Dashboard
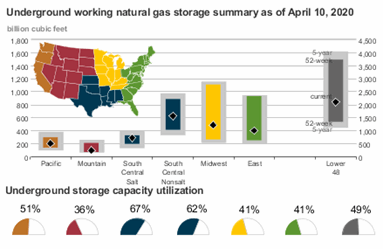
The Natural Gas Storage Dashboard is the essential supplement for the weekly storage report. You can find all the important information that affects the natural gas storage, including:
-
daily regional average temperatures and deviation from normal
-
daily underground working natural gas storage summary
-
statistical measures for each of the five regions in the Lower 48 states (like average temperatures, natural gas consumption for electricity generation and for residential/commercial use, etc.)
-
and even the natural gas futures price (twelve-month strip)

If you are planning to use the Weekly Natural Gas Storage Report, you should also use the dashboard, because the storage report shows the what, and the dashboard shows the why behind it.
You can find the Natural Gas Storage Dashboard here.
3. Natural Gas Weekly Update
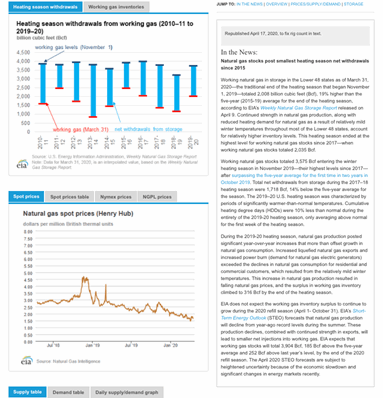
It is a complete summary of the natural gas industry news. This is the report that brings the other two reports together, and shows all natural gas related information. It highlights the current natural gas-related issues and trends, like:
-
Temperature – heating & cooling degree days
-
Monthly dry shale gas production
-
Weekly natural gas rig count
There is a section called “In the News”, which shows the latest news related to natural gas, like prices, supply, demand — everything you need to know.

You can even find the current natural gas storage forecast in this section.
It is an excellent source of natural gas information. If you work in this industry, you absolutely need to follow this weekly update report.
Conclusion - Natural gas storage reports
Natural gas is one of the most used sources of energy. The #1 gas consumer is the U.S., so if you want to follow the latest news about natural gas, you need to follow EIA’s weekly updates.
It consists of 3 reports:
-
Weekly Natural Gas Storage Report
-
Natural Gas Storage Dashboard
-
Natural Gas Weekly Update
The updated numbers are released at 10:30 a.m. ET every Thursday.
